
Intalytics Commentary: Learning from Outliers – Additional Considerations
In a recent Intalytics Q&A, Justin Tischler and I examined the value of studying outliers to better understand key drivers of unit performance. In response to one of the questions posed during the discussion, we addressed the importance of establishing a proper analytical framework. Diving deeper on that particular topic, we have found the following to be fundamental in the execution of a successful outlier review:
- Consider the consistency of unit performance across your network
- Balance time between hypothesis validation and general examination
- Choose a methodology that best fits your objective
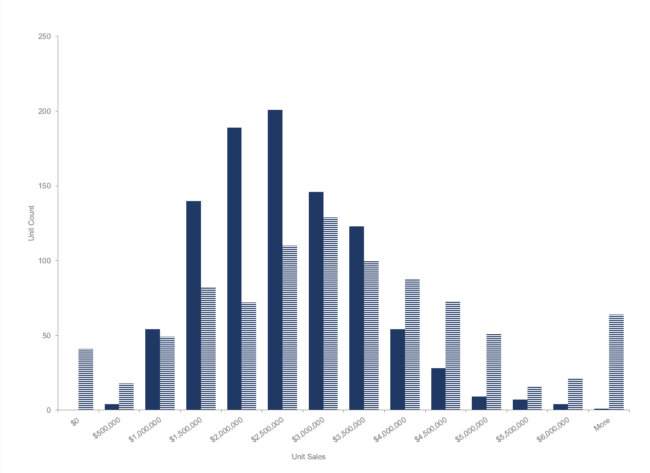
An outlier analysis typically leverages the results of a statistical model which has been calibrated to the performance of the units being analyzed and should, in theory, control for primary drivers. However, it is important to acknowledge that unit count, operational consistency, and data quality all play significant roles in the model development process. Setting aside ample time to review this information is a worthwhile exercise, and I find that a histogram of unit performance makes for a good starting point. A tight, normal distribution (illustrated by the solid blue bars below) will likely yield a more accurate model with a clearer identification of outliers. A wide distribution with spikes at the tails (illustrated by the hashed blue bars below) may indicate higher complexity associated with the underlying performance drivers:
One consideration to keep in mind as you move forward through the analysis is that you are more likely to hit the target when you know where to aim. Outlier review will be immensely helpful in addressing internal hypotheses. By layering in data to address specific questions such as “Should we expand into more college towns?”, you will be able to engage in quick filtering of units which meet desired criteria while identifying the magnitude of over- or under-performance, if any exists.
As a general rule, I advise clients to avoid wandering into random rabbit holes when it comes to data. That said, an outlier analysis is one exception where some disciplined time spent in hopeful exploration can be worthwhile. Be sure to include team members with deep knowledge of your existing network of locations in this process, as their experience may help identify non-obvious commonality and nuance among the over- and under-performing subsets.
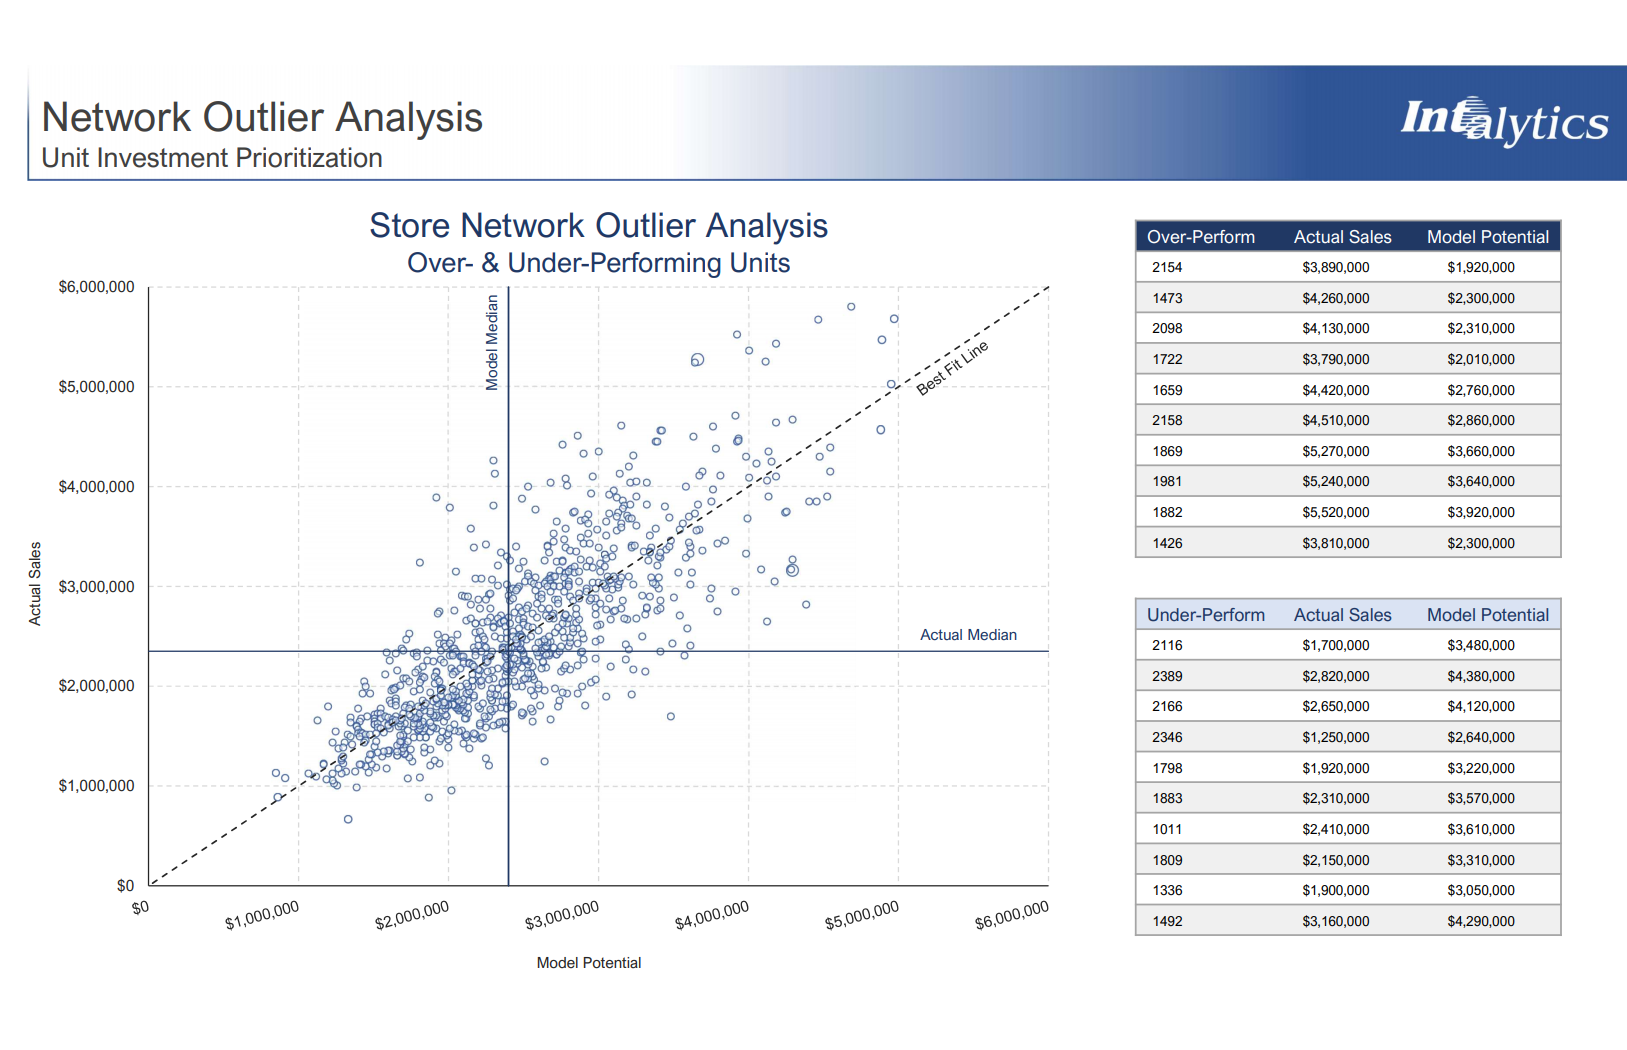
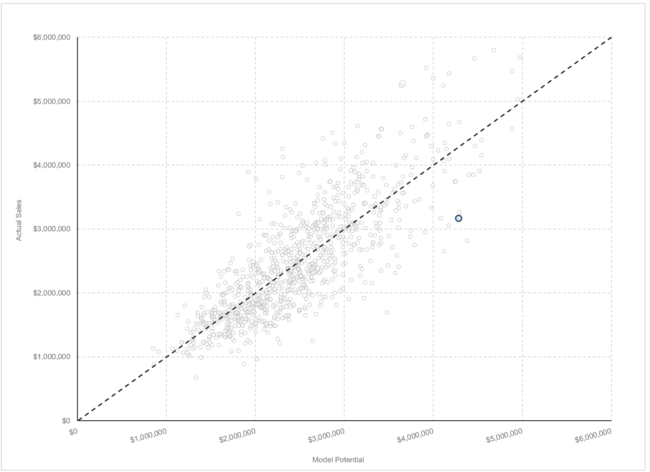
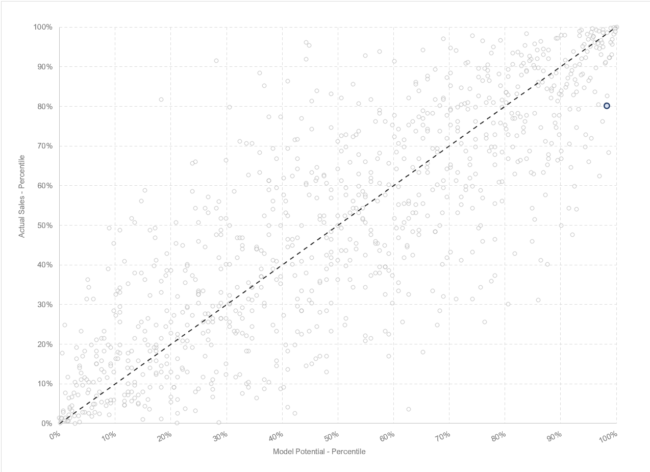
Finally, consider alternative methods to define an outlier, which can reframe the perspective of the analysis. The first example highlights an under-performing outlier with a significant delta between actual and modeled sales potential, which may be more appropriate for estimating the ROI of an initiative aimed at boosting that unit’s performance. Alternatively, the second graph depicts the same unit as a percentile relative to overall network performance. Notice the outlier is less prominent and while still technically under-performing, the model projects this unit to be a high-performer – which it is (in top 20th percentile of all units).
To learn more about how Intalytics partners with brands to identify what drives success in their real estate portfolios and marketing campaigns, please contact us.
Related News
Carousel items