
COVID-19 Fast Casual Case Study Part 2– Daypart Analysis

Your brand’s core customer profile and trade area is likely changing across dayparts—a post-COVID fast casual case study.
As marketers in multi-unit operators react to a post-COVID environment, Intalytics is closely monitoring shifts in brand’s customer profiles and trade areas.
This study explores those shifts at the daypart level, and is a follow-up to earlier conversations with Jim Sellers, Intalytics’ Senior Director of Marketing Solutions, where he urged multi-unit brands to invest in understanding how their customers and their driving patterns are changing. Brands that fail to monitor these structural changes will miss significant opportunities.
Key findings:
- Visit share from the brand’s most affluent customers (and those with the largest household sizes) dropped significantly, declining -15.7% during lunch and -19.0% during dinner
- Lunchtime distance-based trade areas contracted up to 25%
Top-line marketing recommendations:
- Shift media mix from mass to addressable, to target that at-risk most valuable customer segment
- Prioritize regaining the lost visit share from affluent households during the dinner daypart
Detailed discussion:
Q: Jim, in your last post, you used Massive Mobile Data (MMD) data from a 1,000+ location national fast casual brand to show how its customer profile and distance based trade areas had shifted in the period following shelter-in-place advisories. What do you have that is new for us now?
A: We’re exploring the impact by daypart, with a focus on lunch and dinner (accounting for the vast majority of this brand’s traffic) and providing specific suggestions for marketers in light of this shift.
Notable changes in customer profile
Starting with Head of Household age, the most notable shifts are in the 18-31 and 46-55 age ranges. 18-31 share of visit grew across all dayparts, increasing the most during dinner (+13.3%), representing 19.7% of pre-pandemic dinner traffic.
Conversely, visit share from the 46-55 age group showed the largest dinner decrease, declining -10.7%. This important group with larger families and growing buying power represented 26.6% of pre-pandemic dinner traffic.
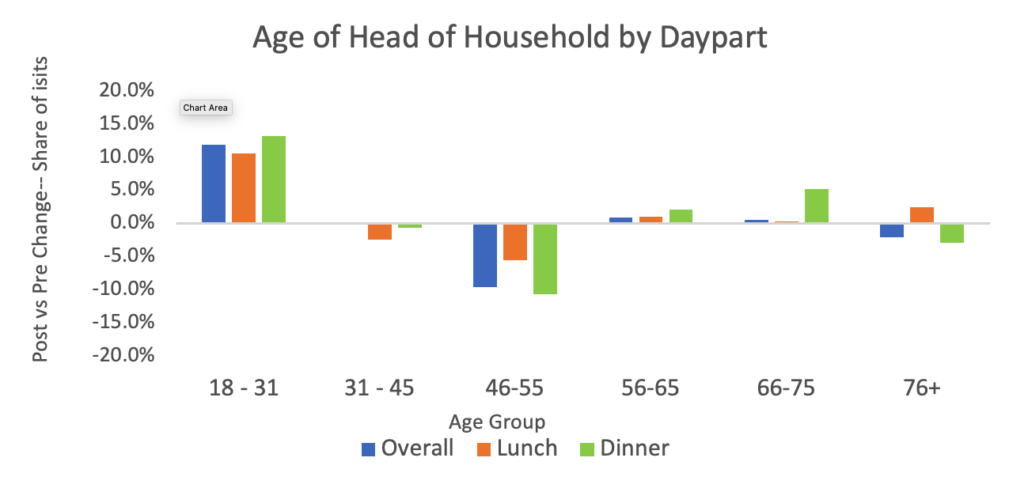
The daypart view exposed several trends that were not apparent when looking at shifts on an overall basis:
- Households in the 31-45 age range showed zero change overall, but declined marginally (0.7%) during dinner and also declined during lunch (-2.4%)
- The 31-45 age group accounted for 33.6% of pre-pandemic visits across both dayparts
- The 66-75 age group actually increased during dinner, up 5.2%, although they only contributed 5.3% of pre-pandemic visits
Using income as the profile variable, dinner is also the daypart that shows the most significant shift.
- Dinner visit share for the <$49K households grew +18.5%
- Share for the $100K+ households declined -15.1%
- Lower income households accounted for 27% of pre-pandemic visits, while the wealthier households had a 41% visit share
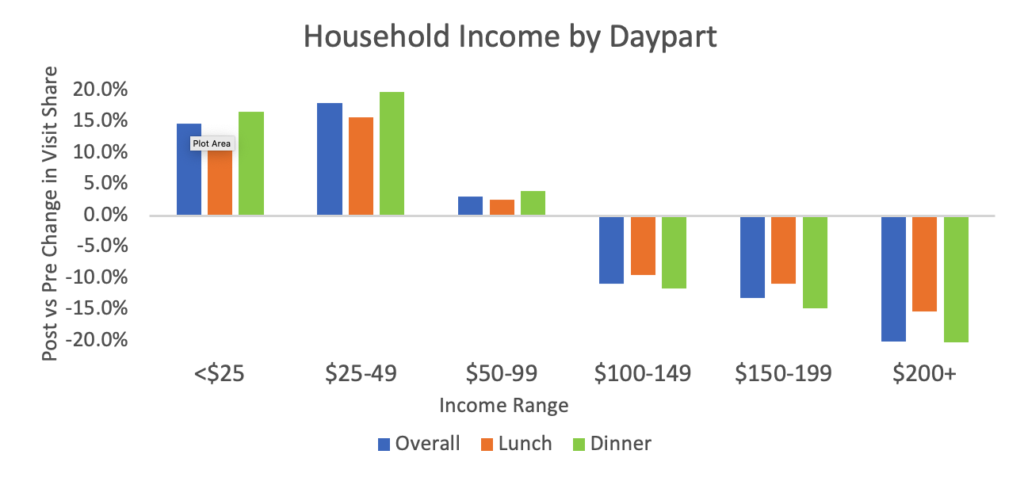
Lunch profiles were also volatile, although not quite to the same degree as dinner
- Visit share in the <$49K households grew +14.5%
- $100K+ households share declined by -11.2%
- The higher income households had the largest pre-pandemic share of visits at 41% of total, compared to 26.2% of visits contributed by the lower income households
Visit share shifts based on household composition broke clearly along the lines of multiple adults versus single adults, with declines in households with multiple adults, and increases from those with single adults.
- Multiple adult households accounted for 61.5% of pre-pandemic visits, and across both dayparts their visit share shrunk by -7.7%, with the bulk of that contraction coming from households with a child present
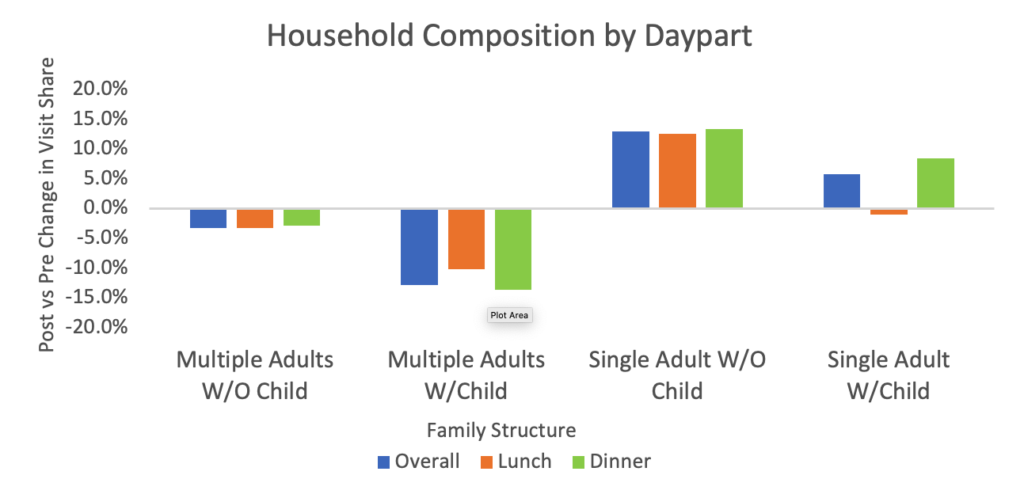
Singles with a child present, however, radically shifted their visit share from lunch to dinner. Lunch share was flat, while increased share during the dinner daypart accounted for all of their relative share swing.
Generally, the dinner daypart showed greater visit share profile volatility than lunch. This effect should be of particular note for restaurant brands where dinner is the primary revenue driver.
Conclusions regarding profile shifts by daypart:
- Dinner customer profile shifted to a greater degree than the lunch customer profile
- As annual income increased, visit share declines also increased, with dinner visits declining faster than declines during lunch
- Households with multiple adults present lost visit share post-pandemic, while single adult households increased share. Multiple adult households represented 61.5% of pre-pandemic visits
These shifts are supported when viewed through a lifestyle or psychographic lens. The chart below indicates changes using Experian’s Mosaic segmentation group profiles. Letter designations at the top of the alphabet indicate higher levels of wealth, affluence, education, and family size, while those further down in the alphabet represent lower wealth, affluence, education, and smaller family size.
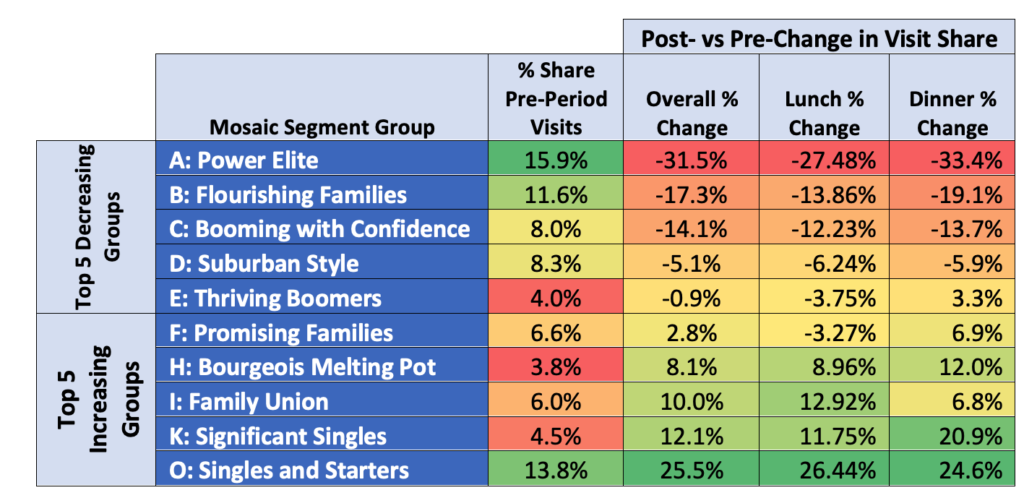
“Power Elite” households had the single largest pre-pandemic share of visits and exhibited the largest decline in visit share across both dayparts. “Singles and Starters” had the second largest pre-pandemic share and had the largest increase in share for both dinner and lunch, although not as great an increase as the loss from the “Power Elite”.
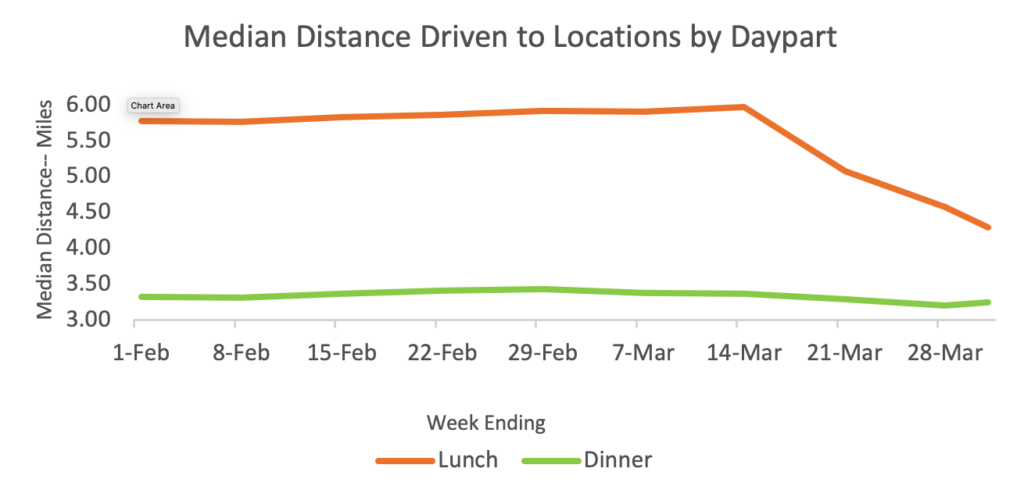
Notable changes in distance-based trade areas
The decrease in miles driven from home to the restaurant observed in our last analysis came entirely from the lunch daypart, declining almost 20% to 4.6 miles post-pandemic as compared to 5.8 miles in the pre-period. Dinner driving behavior was largely unchanged. We infer this was a result of shifts to work-from-home, and came from white collar/professional households whose jobs were suited to work-from-home.
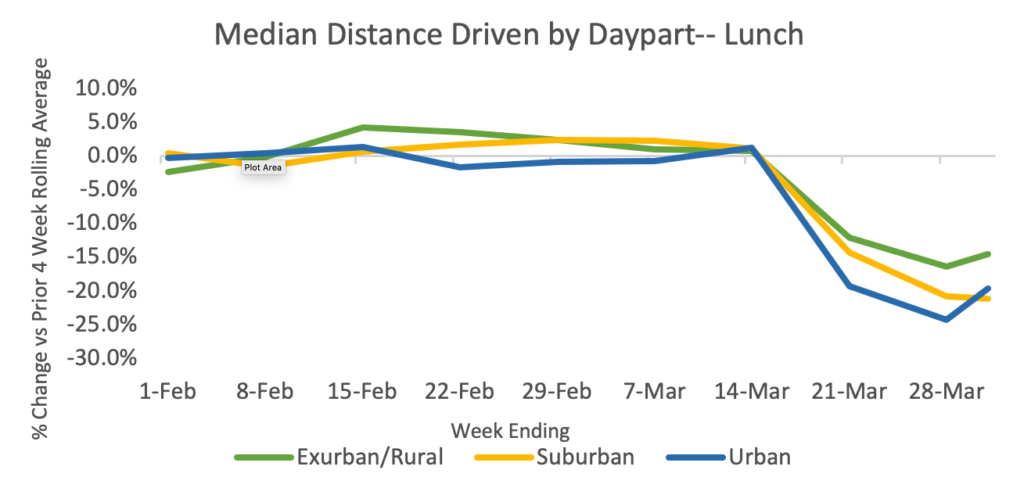
Trade areas in urban restaurants showed the highest degree of contraction during lunch, shrinking up to 25%. Suburban locations, which comprise 61% of the brand’s locations, also contracted sharply. The decline in distance driven for suburban locations had not yet bottomed out, while both exurban/rural and urban began to recover within two weeks of the shelter-in-place advisories being imposed.
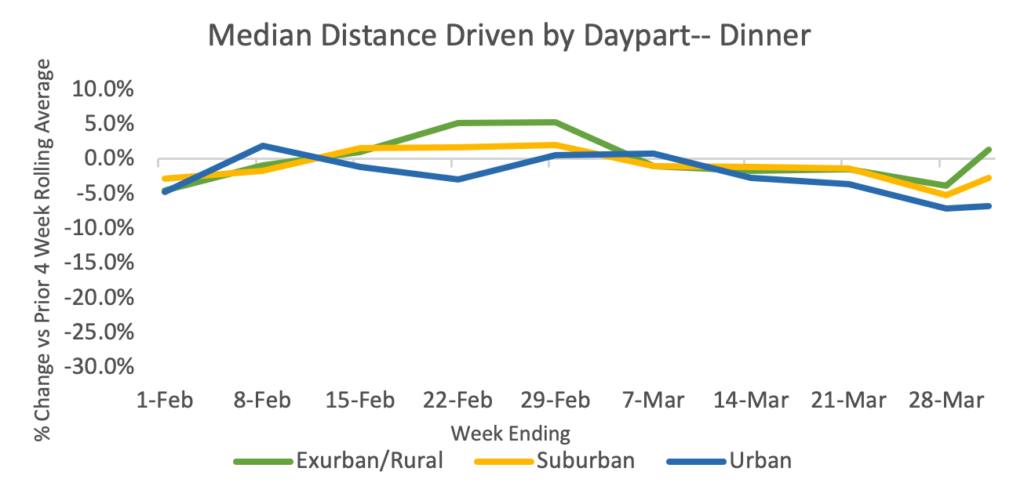
Decreases in miles driven for dinner were modest compared to the strong declines during lunch, and all urbanicities began to move back toward the 4-week moving average in the post-pandemic time frame.
Conclusions regarding trade area shifts:
- Daytime trade areas during the lunch daypart contracted sharply, shrinking up to 25% in the post-period compared to the pre-period as workers across the country left the office to work from home
- Dinner driving behavior stayed relatively consistent
- Suburban trade areas shrank the most during the lunch daypart, and were still contracting at the end of the study period, while both exurban/rural and urban areas started to recover
Implications and considerations for marketers in light of these changing patterns
- The loss of visit share from the more affluent households with multiple adults present represents the greatest threat to a healthy recovery for this brand. 48% of pre-pandemic visits came from households in the five wealthiest Mosaic lifestyle segments. Visit share from these customers dropped -15.7% during lunch and -19.0% during dinner
- From a tactical point of view, actions this brand should consider as the economy begins to open up include:
- Shift media investments away from mass to addressable
- Messaging in mass media should focus on “we’re open”, contactless carry-out, an increased emphasis on employee safety and hygiene, and options for delivery
- Addressable media channels, including banner display, video, and OTT/CTV should be heavily weighted to the more affluent households
- Addressable media offer strategy should focus primarily on the dinner daypart and be designed to appeal to larger households. Family meal offers would be highly relevant, and have the benefit of a positive impact to average transaction size
- A “work-at-home” campaign that has customer convenience as its primary benefit could help regain traction in the lunch daypart. “Pick your favorite day of the week, subscribe to our weekly delivery service, and don’t worry about taking time away from work to fix lunch” is one approach
- Direct mail should not be overlooked as part of the mix, because of its greater reach and more intrusive nature. Direct mail also makes it easy to extend multiple offers through clippable coupons. Daypart-specific offers would help rebuild frequency through a vehicle highly suitable for distributing multiple offers
- Strategically, the brand will need to take steps to align their business model with the new reality, particularly over the period of time where limitations on dine-in capacity are in place
- Implement operational changes to streamline production for carry-out, drive-through, and delivery
- Be nimble in making menu and pricing changes as supply chain disruptions occur
- Improve ease of use for online ordering technology
- Keep close tabs on customer satisfaction through an ongoing tracking program at the unit level, with sufficient sample to stratify findings by daypart and order type
- Move away from “one size fits all” marketing campaigns—where all units get the same campaign support at the same investment level—to a segmented set of campaign options that recognize the differences in market Value Gaps, geographic trade area size, customer demographics, and competitive sets
- Close underperforming locations, those with limited ingress/egress that don’t efficiently support carry-out and delivery options, with little or no outside seating, and where economic disruptions in the trade area are more intense
- Finally—ensure appropriate monitoring systems are in place to capture the kind of shifts in customer profiles and trade areas outlined here. Without visibility into changes occurring—not just regionally or by market—but at the unit level—it will be difficult to rebuild market share, sustain profitability, and recapture lost shareholder value
Follow Intalytics on LinkedIn and Twitter, and contact us to learn more about how predictive analytics and geospatial solutions can help power your business.
Jim Sellers’ career spans multiple industries and brands, including senior marketing and sales positions with FedEx, FedEx Office, Procter & Gamble, Coca-Cola, and Royal Bank of Canada. He can be reached at jim.sellers@intalytics.com
Related News
Carousel items