
COVID-19: Fast Casual Deep Dive

Your brand’s core customer profile and trade area is likely changing – in this blog we present a post-COVID fast casual case study.
A time-series study of consumers visiting a national fast casual operator with more than 1,000 locations shows clear evidence of a post-pandemic shift in both the core customer profile and the drive-time trade area. These shifts—which we anticipate will sustain to one degree or another until a COVID-19 vaccine is widely available—require the full attention of not just restaurant executive teams but also multi-unit operators across all sectors.
This study is a follow-up to an earlier conversation with Jim Sellers, Intalytics’ Senior Director of Marketing Solutions, where he urged multi-unit brands to invest in understanding how their customers and their driving patterns are changing. Brands that fail to monitor these structural changes will miss significant opportunities.
Q: In your last post, you laid out a series of recommendations for how marketers should be reacting to and planning for the “Next Normal”. How has your thinking changed since then?
A: I’ve been looking for evidence to support or refute my initial thinking. Working with Intalytics’ data scientists and analytics consultants, we tapped our Massive Mobile Data (MMD) dataset, and assembled a pre- and a post-pandemic dataset to study consumer behaviors across one national restaurant brand’s ~1,000 locations. Here’s just a sample of what we found:
Notable changes in customer profiles
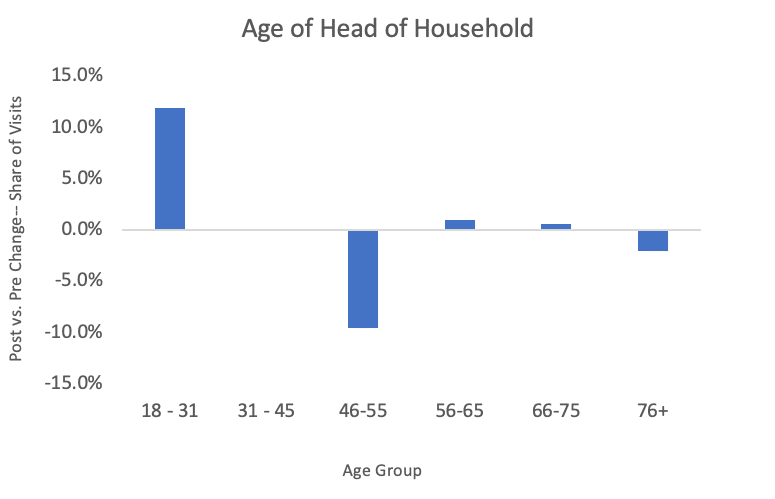
While there was stability in the customer profile in many generational groups, two significant shifts emerged. First, total share of visits from GenZ households (ages 18-31) increased 12%. This group represented 22.2% of the brand’s post-pandemic customer visits. However, GenX (ages 46-55) share of visits declined 10%, and GenX accounted for 25.7% of pre-pandemic customers. Visit share for Millennials (31-45), Boomers (56-75), and Seniors (76+) all stayed relatively stable.
This shift is important for operators to note, as GenZ households don’t have the family size and spending power of GenX households. The risk is that average ticket size will decline along with visit frequency—a financial double whammy.
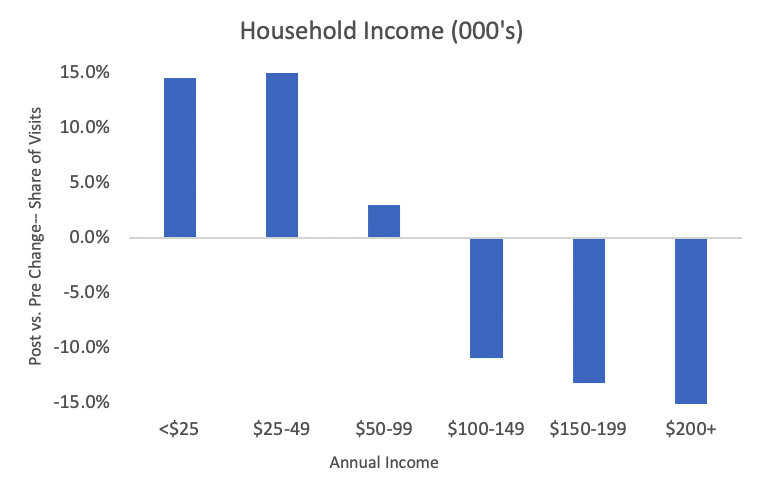
We saw a similar phenomenon when analyzing household income, with potentially even more troubling implications. Visit share from customers where household income is less than $50,000 increased by 15%, while visit share from customers with incomes of $100,000 or more decreased on average by 14%. These wealthier households represented 40.4% of visits in the pre-pandemic period.
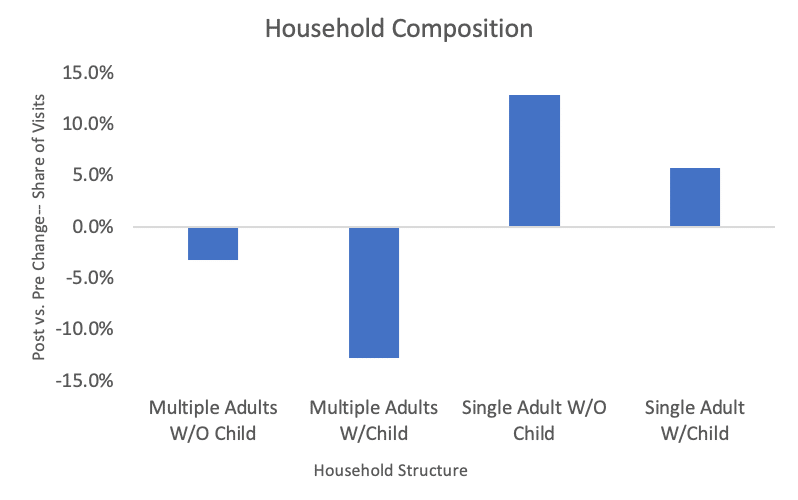
Marked shifts in customer visits were also observed based on household composition. Households with multiple adults present—regardless of whether they have children—saw visit share declines, while those with single adults capture a higher share of visit. As noted earlier, the impact here is likely to be a decrease in both visit frequency and average ticket size.
Conclusions regarding customer profile shifts:
- Post-pandemic, a higher share of visits is coming from households that are younger, lower income, and smaller in size
- Share of visits from older, higher income, and larger sized families have decreased
- On top of the observed decrease in total visits across all demographic groups (see our previous post on this topic), customer profile shifts in groups that have higher average tickets are not likely to be offset by gains in groups with lower average ticket size
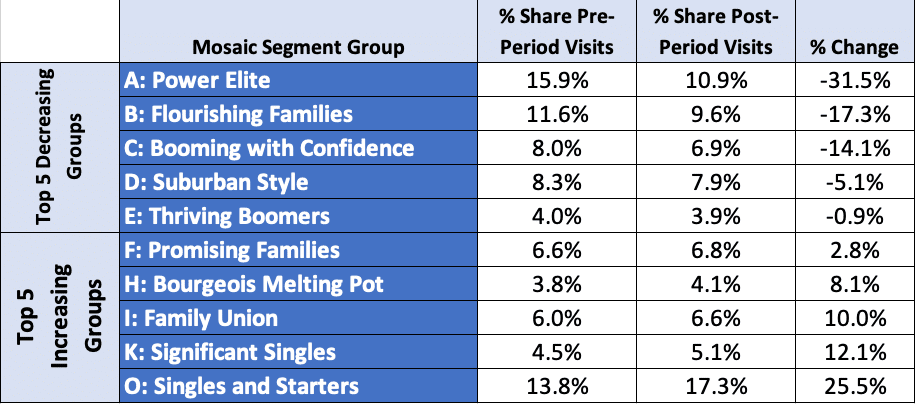
These conclusions are also supported by shifts in psychographic segment profiles. The chart below indicates changes using Experian’s Mosaic segmentation group profiles. Letter designations at the top of the alphabet indicate higher levels of wealth, affluence, education, while those further down in the alphabet represent lower wealth, affluence, and education. These more affluent groups with the highest decline accounted for 47.7% of pre-pandemic visits. Those less affluent groups with the largest increases represented 34.7% of pre-pandemic visits.
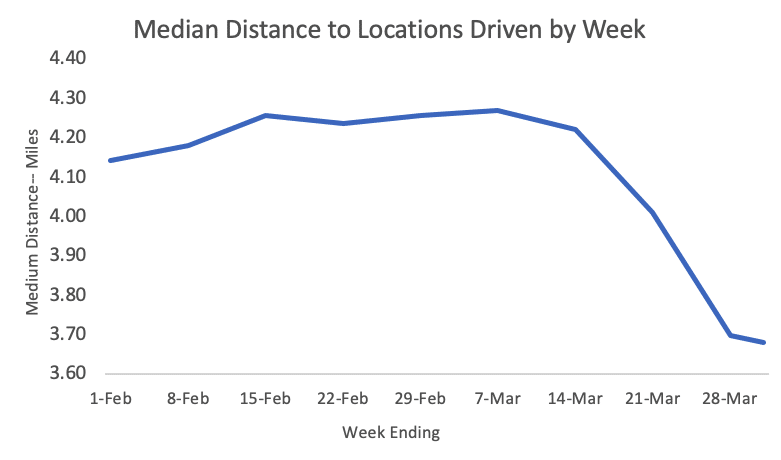
Notable changes in distance-based trade areas
As with the shifts noted in core customer profiles, trade areas changed significantly as awareness of COVID-19 grew and as shelter-in-place orders were imposed. Across all the brand’s locations, the median distance driven from home to restaurant decreased by 10%, from an average of 4.2 miles in the pre-pandemic period to 3.8 miles post-pandemic.
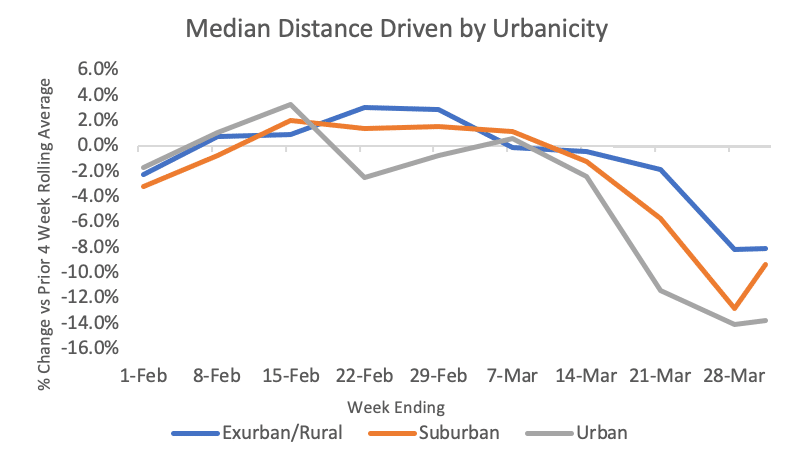
Cutting locations by urbanicity uncovers additional differences in driving behaviors. Urban locations, which account for 25% of the total network, experienced the steepest distance decline. Compared to the prior four-week rolling average, urban customers drove up to 14% fewer miles from home to the restaurant.
Suburban locations represent 61% of the network, and median distances driven decreased up to 13%. It should be noted that there was a clear rebound observed in the last week for suburban customers, indicating that these consumers may have simply settled in to a new normal.
It’s important to keep in mind that these decreases in median distance driven from home to restaurant don’t fully capture the impact of this contraction in trade area size. Measured by the change in percent of total households present in the smaller post-pandemic trade areas, the contraction would be even greater. This is an area that warrants future analysis, and should be of particular importance for marketers. Shifting trade areas must be taken into account so they align with post-pandemic plans for local and addressable marketing tactics as the economy opens up and promotional activity rebounds.
Conclusions regarding trade area shifts:
- Trade areas—in particular those in urban and suburban markets—are shrinking by up to 15%
- The percent decline in the number of households within any location’s trade area is even greater than that of the decrease in median distance driven
Implications and considerations for marketers in light of these changing patterns
- The post-pandemic shifts in consumer behavior and changes in core customer profiles suggest that marketers will need to adjust their strategies and tactics to appeal to two distinct segments:
- On-premise segment. These consumers are characterized by households with lower incomes and a smaller number of family members. While profile findings indicate these consumers remain willing to visit the restaurant, their reduced spending power puts a premium on value offerings. The expected decline in average ticket size, combined with reduced dine-in capacity from social distancing, will dramatically shift the economics of sales per square foot across restaurant categories
- Off-premise segment. These wealthier, more educated consumers with a larger family size are a) not visiting the restaurant at all, or b) shifting their consumption to carry-out or delivery. The higher spending power of these groups, combined with the fact that they represented >40% of pre-pandemic visits, means marketers will need to improve the customer experience for carry-out, and either be willing to absorb the lower margins considering the higher costs of third party/in-house delivery, or adjust their business models to serve this segment. Ghost kitchens, smaller footprint locations, menu changes, and increased production automation are all possibilities to drive per order cost basis lower
- Obviously, these behavioral segments existed pre-pandemic, but in the post period—the findings in our study suggest the differences between the two are even more stark
- Marketers must take steps to aggressively monitor these shifts in customer profile and trade area size to minimize marketing waste from targeting the wrong customer segments, investing in the wrong geographical areas, and overlooking new opportunities as consumer behaviors stabilize with a changed customer profile
- The effectiveness of addressable media—as opposed to mass channels—makes those tactics even more compelling during this period of rapidly changing market dynamics. At least for now—the significant increases in screen time occurring across all socioeconomic groups has also made more digital ad inventory available, with downward pressure on media costs
What’s next?
The next chapter in this exploration of changes in customer profiles and trade areas will focus on a selection of several distinct geographic markets: New York City, Los Angeles, Chicago, Dallas-Fort Worth, and Cleveland. We’ll also take a look to see how these changes are playing out across different dayparts.
Follow us on LinkedIn and Twitter, and contact us to learn more about how predictive analytics and geospatial solutions can help power your business.
Jim Sellers’ career spans multiple industries and brands, including senior marketing and sales positions with FedEx, FedEx Office, Procter & Gamble, Coca-Cola, and Royal Bank of Canada. He can be reached at jim.sellers@intalytics.com
Related News
Carousel items