
Measuring the Impact of COVID-19: Restaurants

As part of our continuing series measuring the impact of COVID-19 on consumer behavior, Intalytics has most recently leveraged mobile device data Massive Mobile Data, or MMD, to measure the impact that the pandemic is having on the restaurant industry.
Intalytics evaluated a broad array of regional and national restaurant chains in an effort to answer a number of questions, including:
- To what extent have different sectors within the restaurant space (Quick Service Restaurants, Fast Casual, Casual Dining, and Coffee) been impacted?
- Do demographic characteristics have any relationship to changes in consumer activity?
- How did the timing of statewide shelter-in-place orders affect activity?
Shifts in Consumer Activity by Restaurant Sector
Along with so many other businesses out there, restaurant operators are faced with a challenging short-term need to adapt – provide alternative options for servicing their customers or close their doors. Some formats are better suited to this speedy adaptation than are others. The near-universal presence among quick service restaurants (QSRs) of drive-through windows provides an acceptable means in this era of social distancing for getting food in the hands of hungry patrons. Fast casual establishments – while mostly lacking the convenience of a drive-thru – nonetheless have historically done a more effective job of driving carryout business than have their casual dining counterparts. And while many coffee shops have the means to adapt to new servicing models, modern coffee shops also find themselves in the unenviable position of providing a product that can easily be made and enjoyed at home.
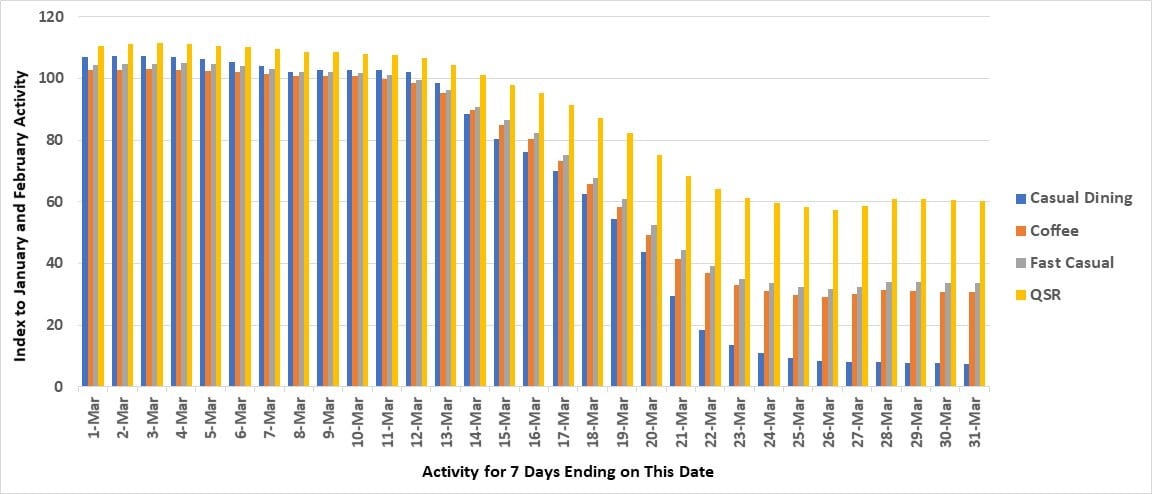
We find that the visit count data largely backs up those hypotheses. The chart below shows device activity over time for restaurants in each sector, indexed against baseline January/February activity:
Observations:
- All restaurant sectors evaluated experienced significant disruption in traffic. Casual dining saw a 90% drop in visits, while QSRs saw a 40% reduction in visits. The fast casual and coffee sectors each saw declines of more than 70%
- Activity in all restaurant sectors began declining at approximately the same time nationally (March 12th-13th), coinciding with the initial rollout of shelter-in-place orders in various cities and states
- All curves flatten to reveal a “new normal” of consumer traffic activity during the last week of March, collectively offset by an average reduction of over 60%
Demographics and Changes in Restaurant Activity
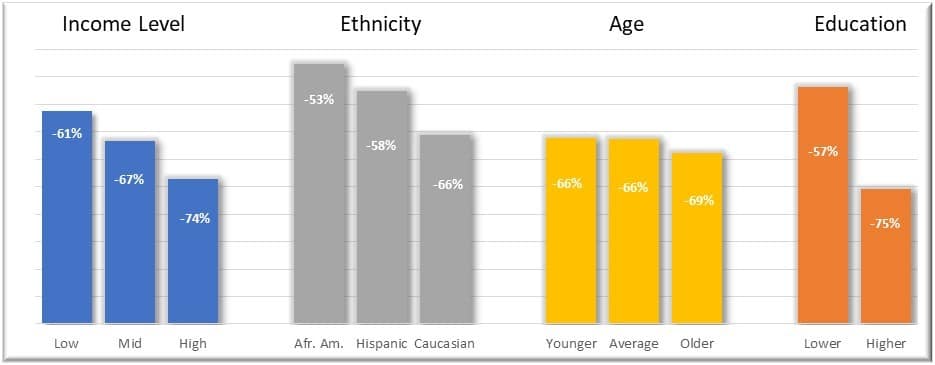
Intalytics assessed the relationship between a selection of demographic metrics to determine whether there were any observed differences in the changes in restaurant visits. The graphs below show the reduction in restaurant visits seen for the last week of March compared to baseline activity in January and February, separately for restaurants situated in differing demographic areas.
A few trends that are apparent:
- Staying at home is a luxury, as evidenced by restaurants in more affluent areas being harder hit. This is consistent with a recent report by the New York Times showing that those households better able to restrict movement were, on average, higher income
- Restaurants located in predominantly minority areas have experienced a less severe hit to visits
- Consistent with the income differences referenced, restaurants situated in the most educated trade areas have experienced a larger reduction in visits
Shifts in Restaurant Activity by State
The following map illustrates the change in visits to restaurants by mobile device holders during the last seven days of March as compared to baseline activity observed in January and February:
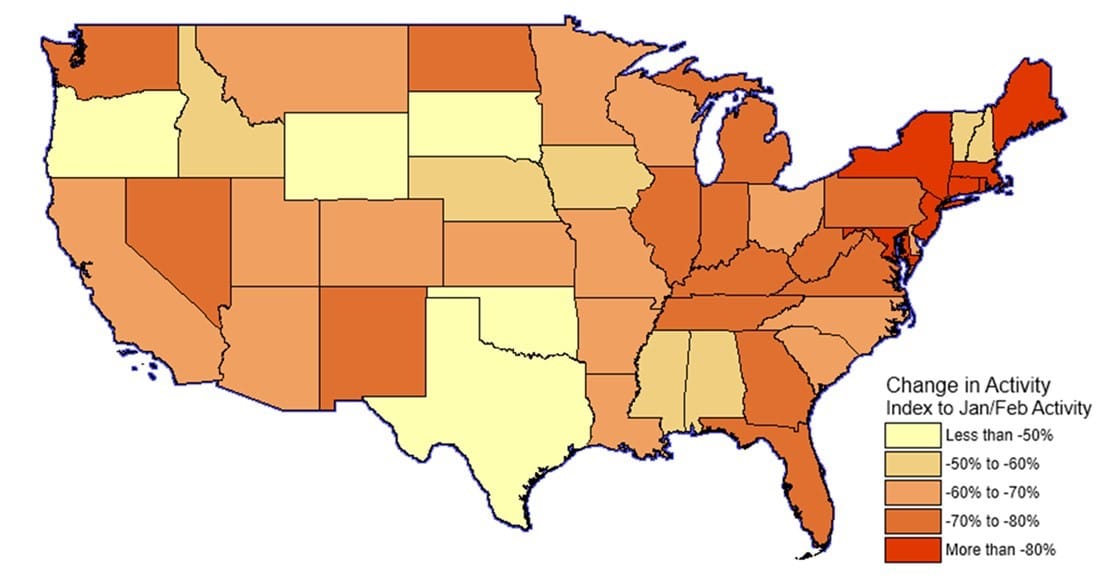
States shaded in dark red experienced the highest reduction in activity, while states shaded in yellow saw the lowest drops in activity.
States throughout the Northeast and down into the Mid-Atlantic saw the highest impacts, with each of Rhode Island, New Jersey, and Maine off nearly 90% from pre-pandemic activity levels. However, those states that are relatively less impacted still see large declines relative to baseline.
Some of these differences are no doubt attributable to differences in policies from state to state, as well as differences in population density and/or the severity of contagion.
Shifts in Restaurant Activity – Major Markets in Select States
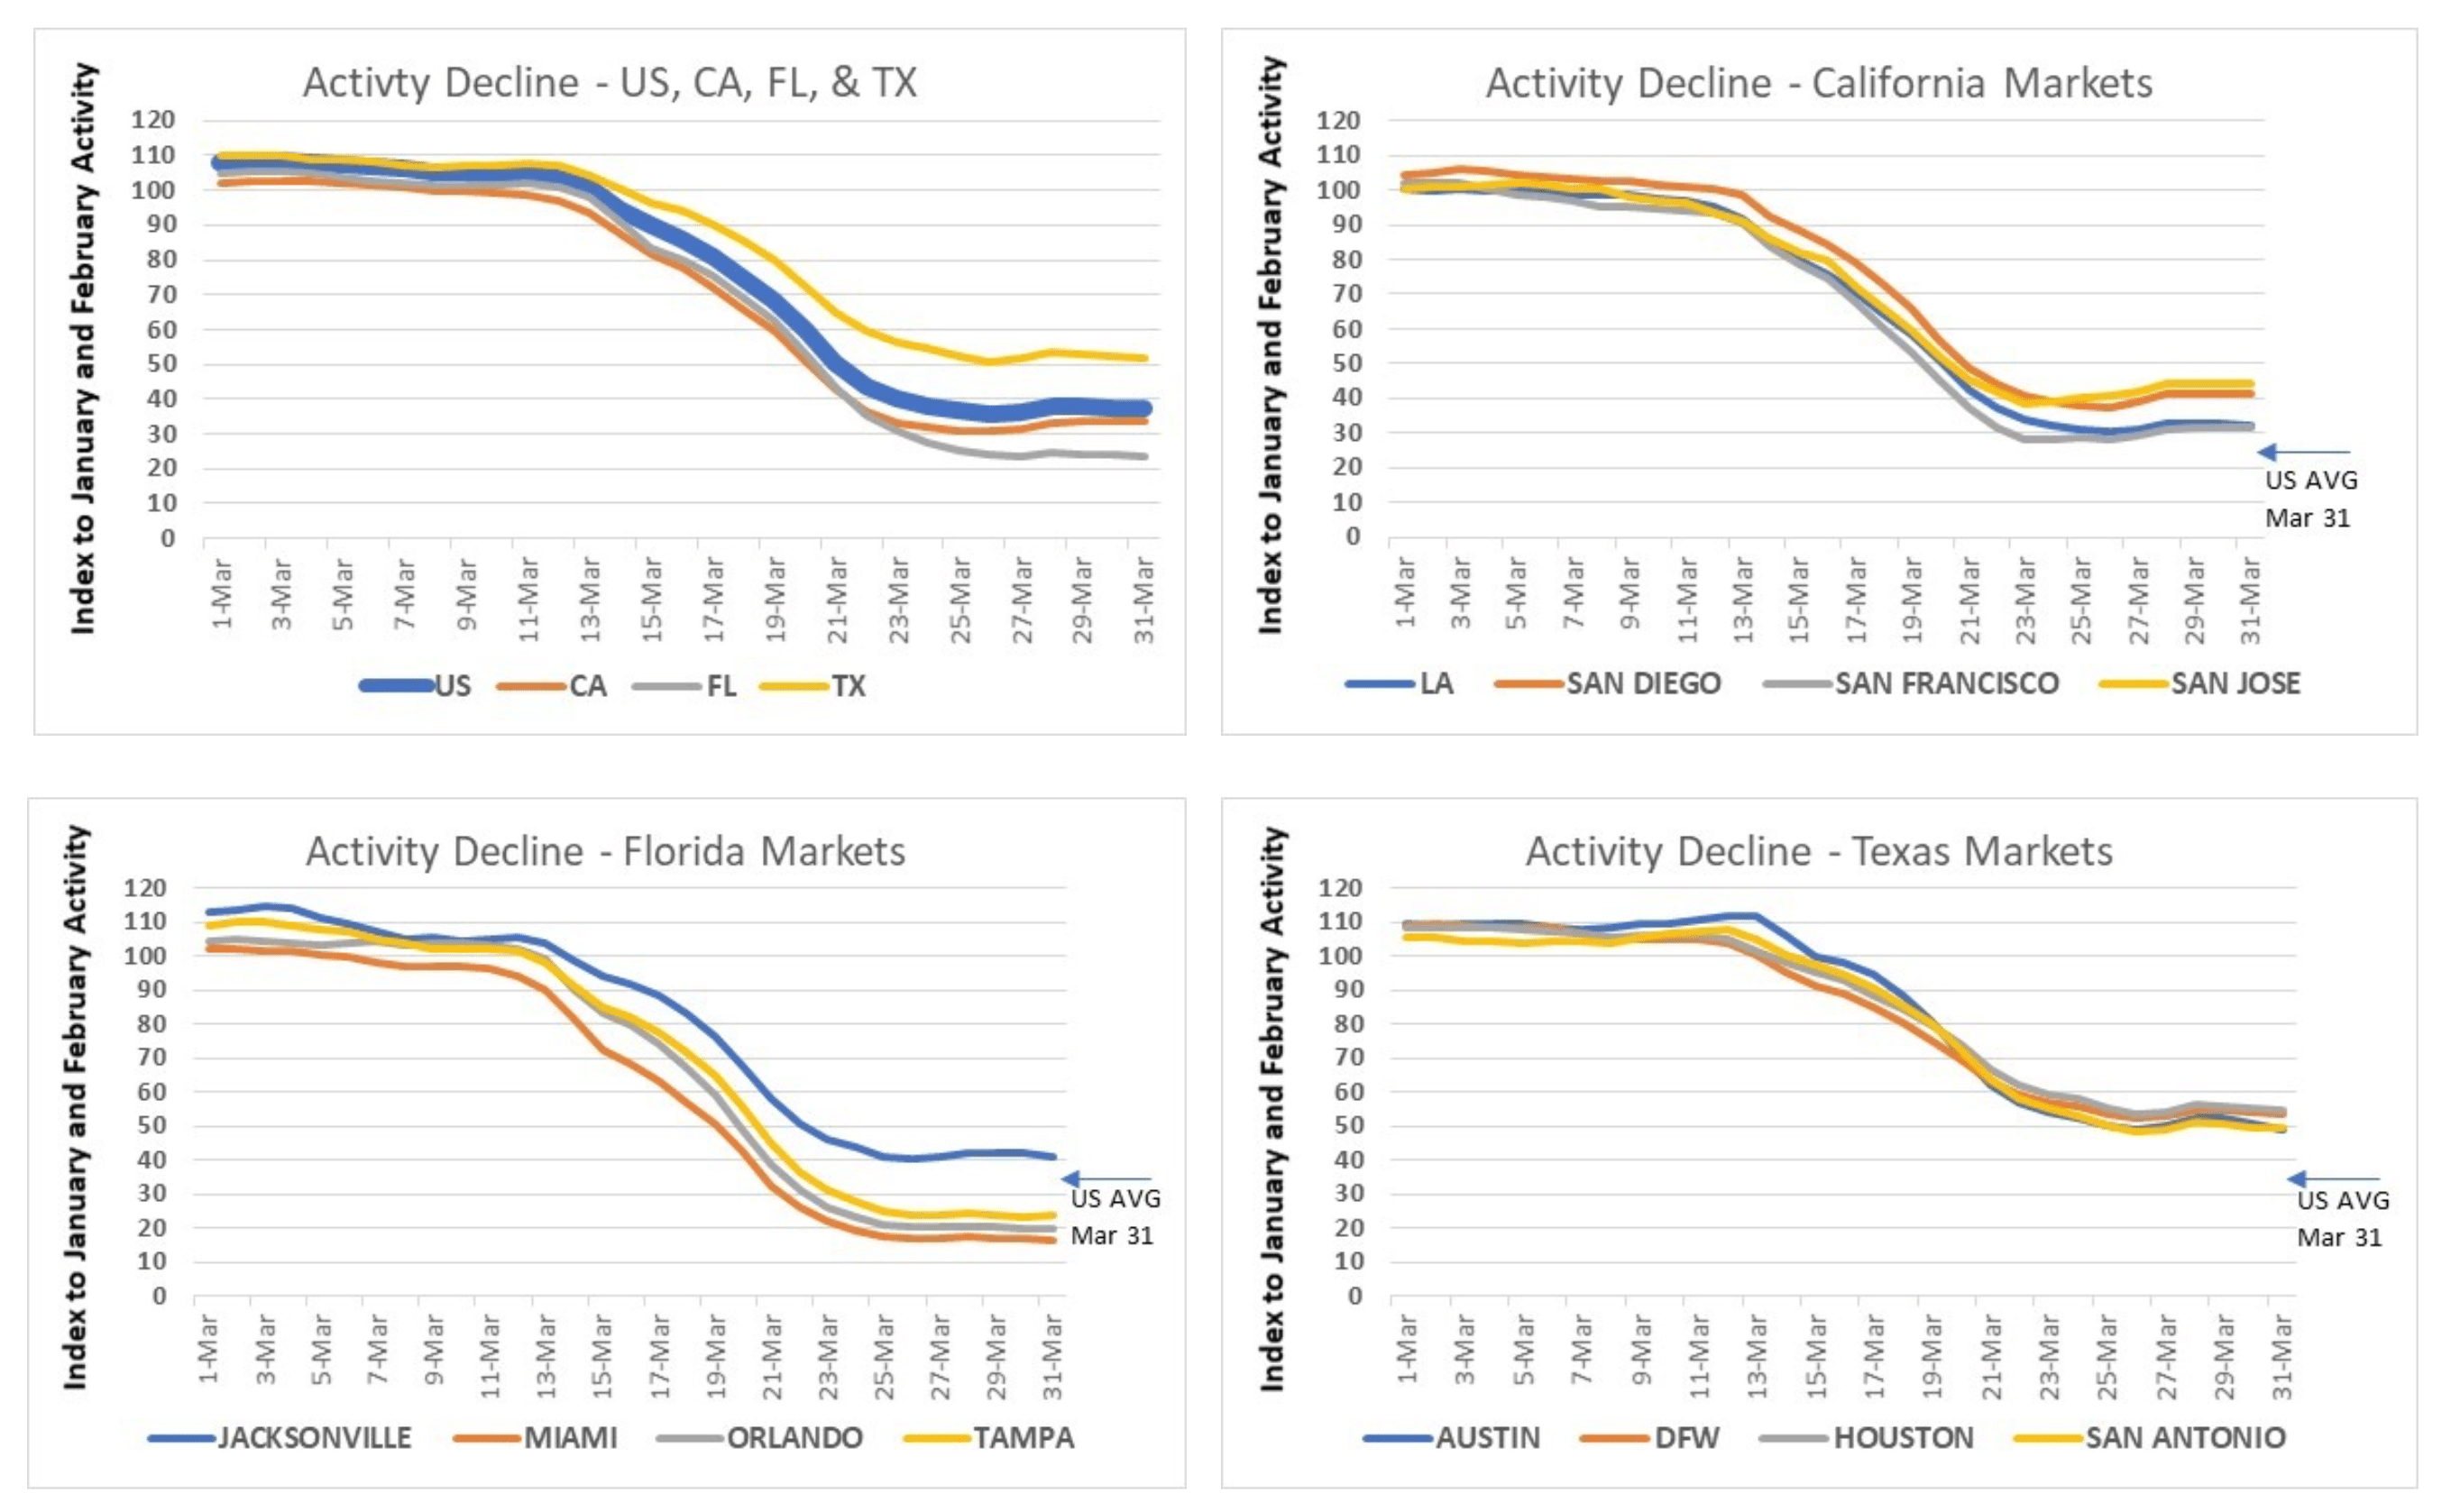
Intalytics also evaluated select states (California, Texas, and Florida) and large metropolitan areas within these states to determine if there were any local or regional differences in restaurant activity.
Findings:
- Shifts in consumer activity for metropolitan areas within each state tend to be closely related
- Observed declines in consumer activity are generally consistent with national trends, although there are significant differences by state:
- Restaurant-related consumer activity in Texas has not been impacted to the same degree as the U.S. generally
- Except for the Jacksonville metropolitan area, major markets in Florida have seen the largest reduction (~80%) in restaurant-related consumer activity
While the evaluation of restaurant-related consumer activity yielded interesting findings, we believe that an even more compelling set of questions remain unanswered – to what extent have restaurant trade areas increased/decreased, and how are the demographic and psychographic profiles of restaurant patrons shifting? In a forthcoming follow-up, Intalytics will conduct a deep-dive analysis aimed at answering these questions. To learn more about how our analytics can inform your decision-making in this unprecedented time, please contact us for an introductory discussion.
Related News
Carousel items