World Series Game 7 – Who Were Those Lucky Fans in the Stands?
We have written before about the significant value that massive mobile data (latitude/longitude coordinate data from location-enabled mobile devices) can provide in the development of sales forecasting models. In addition to providing consumer insights for clients who do not have access to customer address data, there are many other uses for massive mobile data in the retail and restaurant industries:
- Competitor Sales Volumes – massive mobile data can be used to estimate sales volumes for individual competitor locations
- Cross-Shopping Activity – massive mobile data can quantify the level of cross-shopping that occurs with other brands
- Quarterly Sales Performance – massive mobile data can help to quantify anticipated quarterly sales performance for retail and restaurant chains ahead of announced earnings results
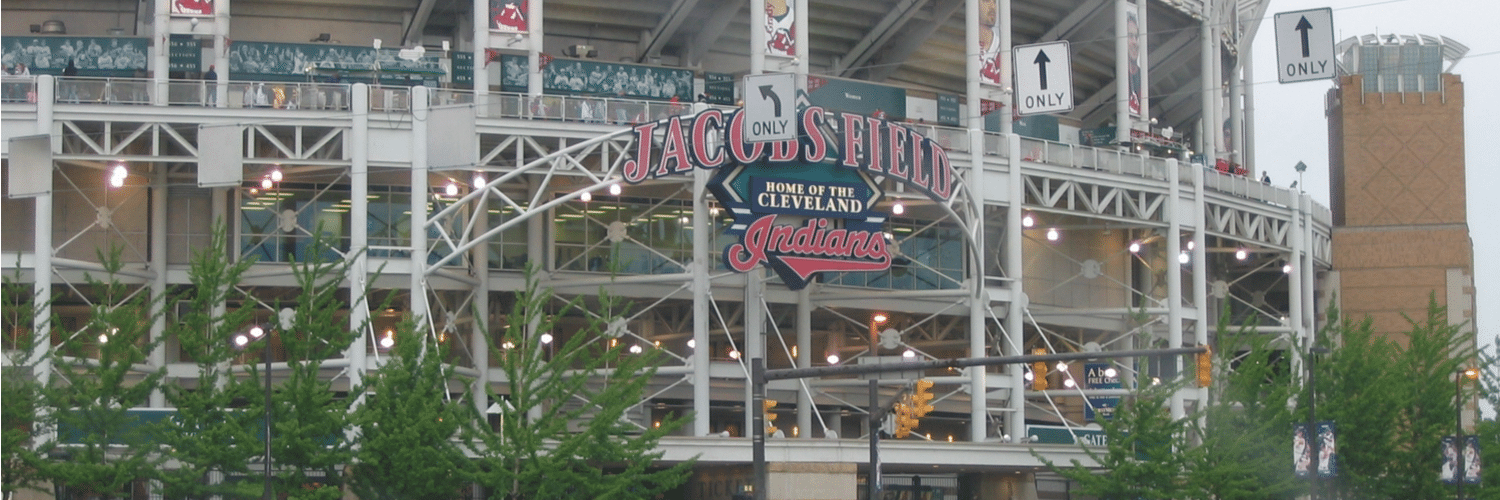
Massive mobile data also has the power to provide less analytical (and more “fun”) insights. Intalytics developed a profile of individuals fortunate enough to have attended Game 7 of the 2016 World Series in Cleveland (the deciding game, for all you non-baseball fanatics).
First, we geofenced (drew a border around) Jacobs Field in Cleveland:
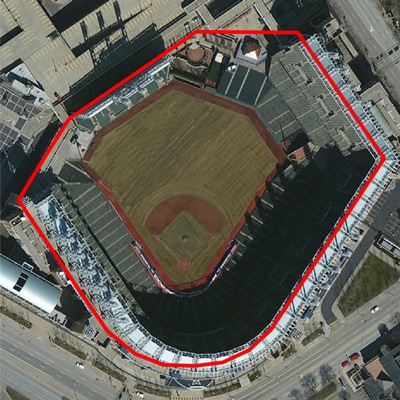
Next, we mapped the massive mobile devices that were detected inside the geofenced area between 6:00 pm on Wednesday, November 2 and 2:00 am on Thursday, November 3, 2016. (The actual game occurred between 8:00 pm on November 2nd and approximately 12:30 am on November 3rd – we wanted to be sure to include as many fan observations as possible.)
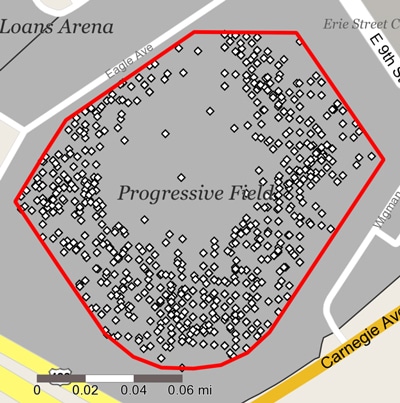
(please note that some mobile devices were actually detected on the field – these likely represent a combination of members of the grounds crew and baseball executives, friends and family members of the victorious Cubs, and not infielders anxious to broadcast tweets in real time)
Intalytics then asked, Where did these fans come from?
Leveraging massive mobile data we identified the state where each mobile device originated from (inferred primary residence):
| State | % of Devices |
| Ohio | 68.6% |
| Illinois | 16.1% |
| Indiana | 3.0% |
| Michigan | 1.5% |
| New York | 1.1% |
| Pennsylvania | 1.1% |
| California | 1.0% |
| Florida | 1.0% |
The DMA (Designated Marketing Area) where each mobile device originated from (inferred primary residence):
| DMA | % of Devices |
| Cleveland Akron (Canton) OH | 59.1% |
| Chicago IL | 15.8% |
| Columbus OH | 4.0% |
| Youngstown OH | 2.3% |
| Toledo OH | 2.0% |
| Detroit MI | 1.0% |
Two things become apparent. One – Chicago fans traveled well, given that one in six fans at the game were determined to reside in the Chicago area. Two – either there are a lot of frustrated Tigers, Pirates, or Phillies fans who want an opportunity to see a World Series game and don’t have the patience for their own team to get there, or there are a lot of Chicago/Cleveland fans who have moved to other markets and came back for Game 7. In total, one-half of the attendees reside within 30 miles of Jacobs Field.
Intalytics then evaluated the psychographic composition of Game 7 attendees. Three MOSAIC lifestyle groups accounted for almost 40% of all attendees:
- Power Elite – The wealthiest households in the US, living in the most exclusive neighborhoods, and enjoying all that life has to offer
- Booming with Confidence – Prosperous, established couples in their peak earning years living in suburban homes
- Flourishing Families – Affluent, middle-aged families and couples earning prosperous incomes and living very comfortable, active lifestyles
Clearly, affluence is a helpful criteria when trying to purchase World Series tickets (let alone for a Game 7 of this magnitude)!
Related News
Carousel items