
Measuring the Impact of COVID-19: Airport Terminal Traffic

Through a combination of shelter-in-place orders, changing corporate policies on travel and work from home, and attempts to avoid contracting COVID-19, how we move around the country has changed drastically in just a few weeks. A recent New York Times article leveraging data from Intalytics’ partner Cuebiq shows how people are traveling shorter distances in recent days compared to February.
While these changing patterns have hit many industries hard, commercial airlines and related businesses are among the most impacted. Intalytics decided to undertake a study of airport terminal foot traffic leveraging mobile data to understand how and where activity changed, and to help inform possible scenarios for recovery of activity once life gets back to a new normal.
For this study, Intalytics geofenced airport terminals for the 127 U.S. hub airports, as defined by the FAA. Hub airports are categorized based on traffic:
- Large (30) – approximately 9.0 million to 52.0 million enplanements per year (ATL, LAX, ORD, DFW)
- Medium (30) – approximately 2.4 to 8.9 million enplanements per year (BNA, DAL, AUS, MCI, HOU)
- Small (67) – approximately 0.5 to 2.3 million enplanements per year (MEM, OKC, DSM, MYR)
For each geofence, we pulled activity from January 1st, 2020 through March 30th, 2020. Activity presented in the visuals below represent a comparison of activity against the month of January, which is used as the baseline.
Consistency of Decline
The chart below shows indexed activity at the 30 large hub airports for each 7-day period in February and March:
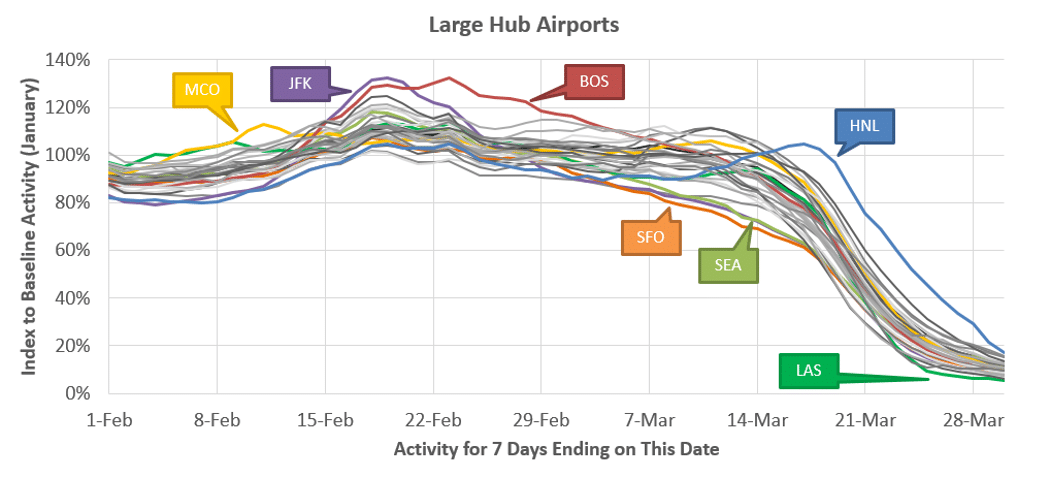
This chart is striking in the consistency of decline felt across all large hub airports. Not only do all end up at less than 20% of baseline activity for the week ending March 30, but they follow similar patterns over time. A few slight exceptions to this include:
- Honolulu (Daniel K Inouye) feels both a later spring break effect as well as a later decline. Possible explanations include affluent individuals choosing the Hawaiian Islands as a safe place to shelter for an extended timeframe, as well as households with second homes in Hawaii electing to shelter there vs. their primary residence.
- Seattle-Tacoma and San Francisco drop more gradually but earlier than many others.
- Las Vegas (McCarran) rapidly moves from middle-of-the-pack to having the hardest hit in the last few weeks.
- New York (John F. Kennedy), Boston (Logan), and Orlando all experienced positive shocks earlier in February before joining the decline felt by other airports.
Different Reaction Speed
Another way to visualize this data is to find the date at which each airport first hit the -50% activity milestone. The map below illustrates these dates for large and medium hub airports:
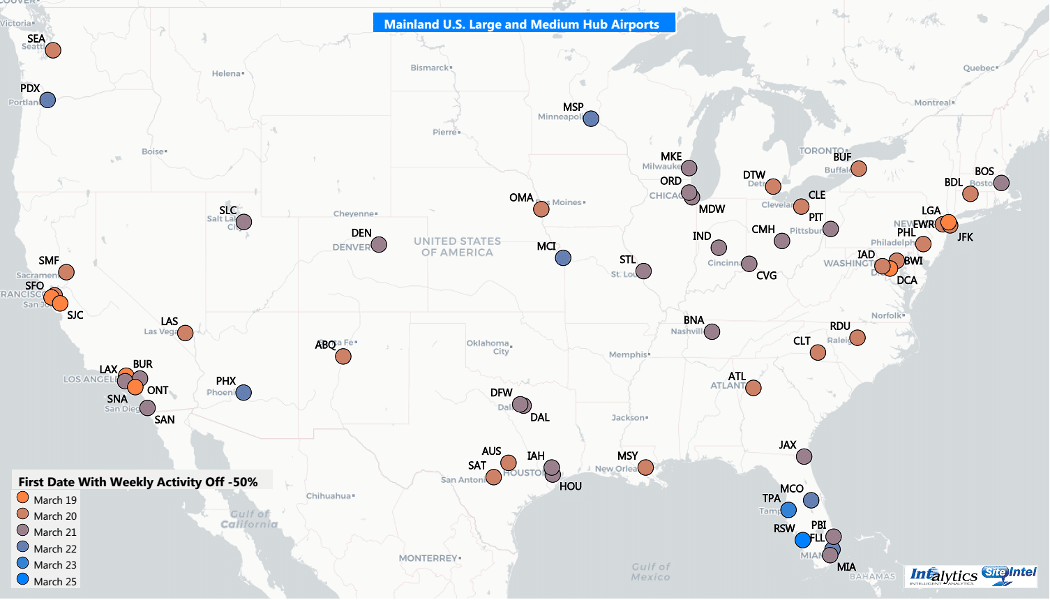
Looking to the brighter orange (earlier decline) airports, it is apparent that major airports in California and along the DC-to-NYC corridor were among the first to feel that impact, likely as a result of earlier changes in public policy. Florida airports stand out as some of the latest to experience these declines, possibly reflecting moves by snowbirds to shelter in a more favorable climate, or even potentially due at least in part to lack of coordinated public efforts to close tourist hot spots over spring break.
Where We Are Now
So where does that leave us now? The tables below show current activity indexed to baseline for the most- and least- impacted airports by hub size:
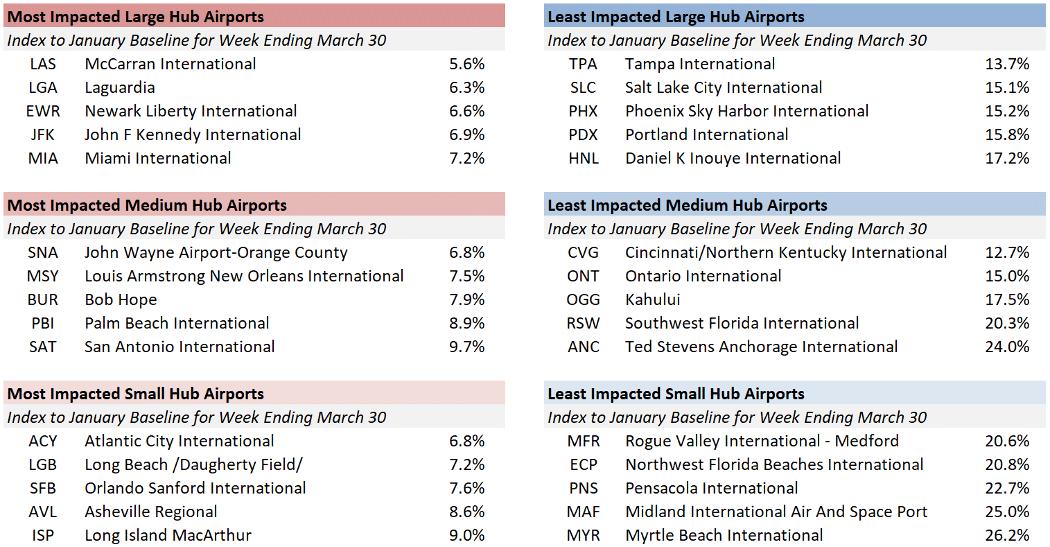
This data paints a bleak current picture for restaurants, retailers, and service providers with airport terminal locations, as all airport terminals studied are off more than -70% from typical traffic. Additional comments:
- The current depressed levels of activity are temporary. Airport terminal activity will resume at some point in the future, and these locations still represent a very viable deployment option for operators seeking to diversify their unit portfolio to include captive audience/non-traditional venues.
- Not all airports are equal. While it is clear that terminal activity has been affected similarly across airports, the impacts have not been equal. When economic and traveler activity begins to resume, it is also true that some airports will recover earlier or more fully than others.
Which airports recover the most and how quickly they get there depends on many factors, but ultimately presents an opportunity for any operator who seeks to capitalize on available terminal real estate to use data to detect and act on those trends early. Intalytics stands ready to help in that regard – to learn more about how we help clients with understanding non-traditional deployment opportunities, please contact us for more information.
Related News
Carousel items