Measuring the COVID-19 Recovery: Shopping Centers (Update)

Several weeks ago, Intalytics reported on the resurgence of activity that was well underway at shopping centers across the U.S. For this flash update, we now evaluate mobile device data through the Independence Day holiday to identify how consumer activity continues to trend, and which markets are experiencing the strongest (and weakest) resurgence.
Continued Resurgence of Activity
The chart below illustrates consumer activity over time for rolling one-week periods beginning in March and continuing through the July 4th holiday weekend. Activity is indexed against average activity observed in January and February.
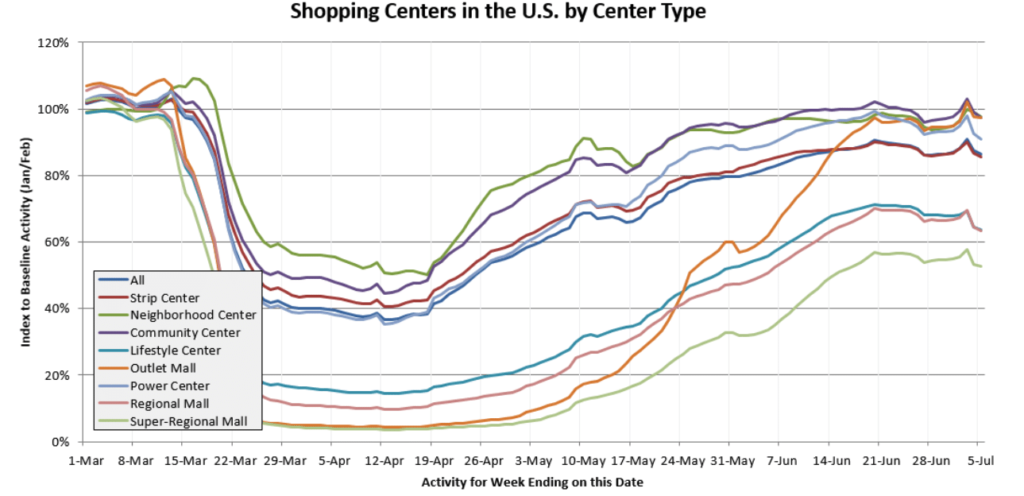
The chart above shows that the trend of resurgent consumer activity evident on Memorial Day has largely continued across the country. Some select observations:
- As we previously anticipated may be the case, outlet locations have done very well. While these locations were initially some of the hardest hit centers, their levels of activity are largely back to pre-COVID norms. While this is likely mostly attributable to people choosing to travel (and especially by vehicle) for their summer holidays, the non-enclosed nature of many of these malls may be a factor, as well as the increased attractiveness of value options for cash-strapped households.
- While activity is up considerably from April lows, regional malls and lifestyle centers continue to struggle, suggesting a continuation of the trend toward more transactional and less experiential shopping for the average consumer. Additionally, the increases seen in these centers seem to have stalled out through the month of June.
- Smaller standalone centers (strip/neighborhood/community) continue to be among the strongest performing locations relative to their peers. However, growth in all categories seemingly stalled by late June – possibly due to increases in COVID case rates or simply a settling on a temporary new normal.
Market Comparison
The map below shows how activity has changed in each U.S. market (measured using designated market areas, or DMAs) between Memorial Day and Independence Day. Brighter red values indicate a larger relative increase in activity, while the deepest blue values indicate a decrease in activity.
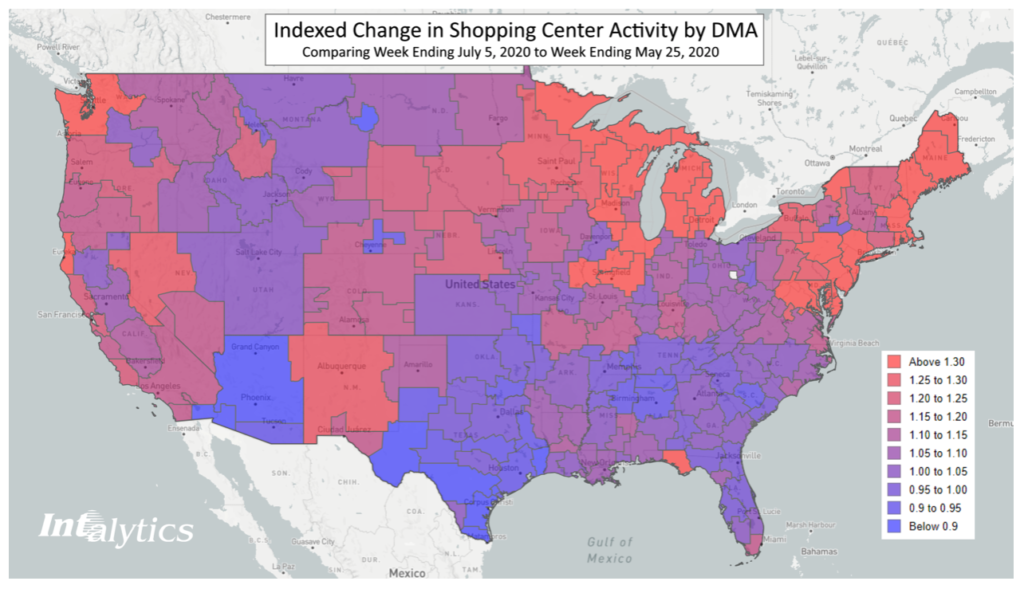
With the exception of some tourist hot spots (e.g. Panama City, FL), the areas that are currently being most affected by increasing COVID cases are those that have experienced a slowing of activity between the two holidays. Markets in Texas, Florida, and Arizona are among those hardest hit as of late, and geographic markets within these states also show a relative contraction in activity compared to Memorial Day levels. Conversely, markets in Michigan and parts of the northeast which waited longer to re-open have experienced the bulk of their resurgence just in the last couple of months.
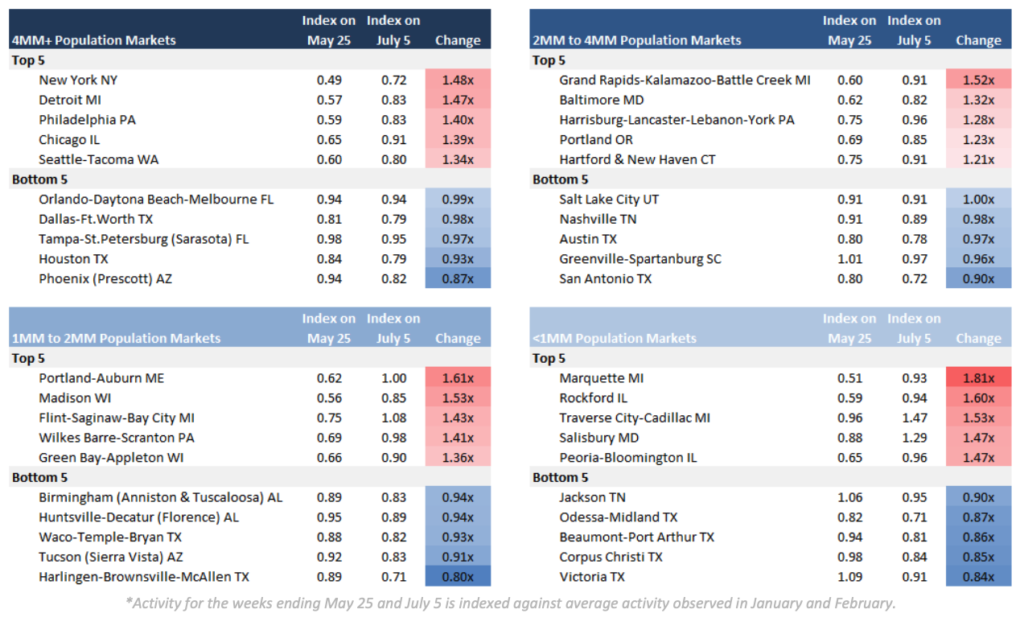
The tables below further summarize the top and bottom markets ranked by the shift in activity over this period in time:
To learn more about how Intalytics can leverage mobile device data to inform your organization’s site selection and target marketing strategies, please contact us for more information.
Related News
Carousel items