
Best Practices in Impact Measurement

A critical part of a comprehensive site selection strategy is understanding how future pipeline locations will impact the existing portfolio. Particularly helpful in market infill planning, cannibalization analysis and resultant transfer studies help decision-makers better understand the ramifications of future deals and their potentially negative impact on the profitability of existing locations.
While the performance of an existing location is easy to measure (with some exceptions), measuring the impact that a newly opened location has had on the sales of surrounding locations requires a considerably more nuanced approach.
Impact Measurement – An Attribution Problem
Consider this scenario: a brand decides to open a new location several miles away from the only other location they operate in that market; one year later, the original location reports sales that are 30% lower than the prior year. This negative comp sales number is easy to calculate, and it is tempting to ascribe the sales decline as the amount of sales cannibalized by the new location. But there are a multitude of factors beyond the opening of a new sister location that could drive shifts in performance, including:
- Sales lift/drag for the full chain caused by macroeconomic trends, brand marketing, introduction of new product/service lines, etc.
- Changes to nearby demand such as population growth/decline, employment growth/decline, tourism effects, traffic increases/decreases, shifting demographics, etc.
- Changes in unit operations such as management hires, staff training, product/service quality, hours of operation, etc.
- Market-wide adverse operating conditions such as harsh weather events, the loss of a major employer(s), etc.
- Opening/closing of competitors in the trade area
This confluence of many possible factors that could be causing the original location’s sales to decline creates an attribution problem – how much of that 30% sales reduction should be attributed to the new location opening vs. all of the other things that could drive performance changes?
To isolate the cannibalization inflicted by the new location, Intalytics relies on control group comparisons of comp sales. More specifically, Intalytics indexes the year-over-year performance changes by month for the impacted location against the comparable data for a group of “control” locations, making sure that the control group is comprised of locations operating in situations comparable to the impacted location with the notable exception that none have had new sister locations open in their vicinity within the past two years. One such example is illustrated below.
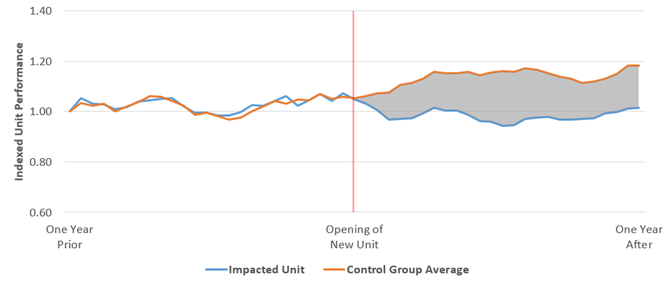
In this example, the impacted location has experienced comp sales that are stable to slightly declining year-over-year after the new location opens. However, the control group locations experienced considerable growth over the same period of time; growth that the impacted location would likely otherwise have achieved were it not for the opening of the sister location. In this example, the impacted location’s performance is clearly lagging relative to the control group locations. The shaded gray area represents the aggregate cannibalization estimated using this approach.
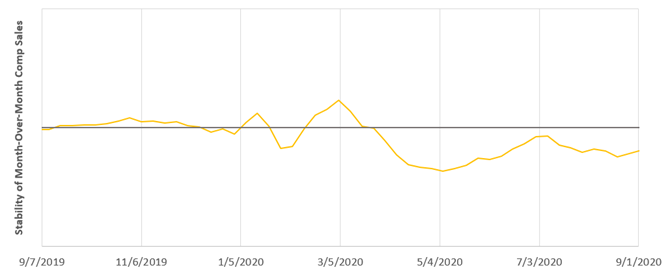
But what can be done in situations such as the one created by the coronavirus pandemic, where all locations experience drastic shocks at staggered times? Consider the chart below, which illustrates for one national operator the amplified volatility in comp sales experienced as the coronavirus pandemic began to take hold in the U.S. Values below the black line indicate less stability in monthly comp sales rates across locations (higher rates of variance).
In light of the challenges presented by this volatility, we offer several suggestions to anyone seeking to more accurately estimate retrospective impacts:
- Use a rigorous control group selection process.
Sample sizes permitting, try to ensure the control group locations are analogous to the analysis location in as many dimensions as possible. Ideally, control group locations should have a similar geographic/regional disposition, be located in similarly dense areas, share prototypes and location features, etc. This will ensure that as many of the other possible drivers of performance are sufficiently controlled for.
- Screen the control group for outliers (locations and sales).
The control group should be a stable set of locations used as a benchmark. Including anomalous locations in this mix – or including drastic sales swings – could undermine the accuracy of any estimated impact. Additionally, it may be appropriate to carve out anomalous time periods that impact locations at different levels from consideration entirely, such as holiday periods or COVID-affected date ranges.
- Evaluate the analysis location for other potential external shocks.
Even with a perfect control group, the impact estimate may still be off the mark if some other event coincided with the new location opening. Review the impacted location’s performance drivers to better understand whether something other than the new location likely caused any observed sales fluctuation.
To learn more about how Intalytics can incorporate impact estimation and forecasting into your enterprise site selection strategies, please contact us.
Related News
Carousel items